Tag: General News

  • Tinubu Names Gavi’s Chief Strategist Kelechi Ohiri DG NHIA, Muyi Aina CEO NPHCDA

    President Bola Tinubu has appointed new chief executive officers for the National Primary Health Care Development Agency (NPHCDA) and the National Health Insurance Authority (NHIA).

    Dr. Kelechi Ohiri, formerly the Managing Director for Strategy at the Global Alliance for Vaccines in Geneva, Switzerland, was named Director-General / CEO of NHIA.

    Dr. Muyi Aina, a public health expert, was appointed Executive Secretary / CEO of NPHCDA.

    Aina earned his medical degree from the University of Ilorin, Kwara State. Additionally, he holds an MPH in International Health from Harvard University and a PhD in infectious disease epidemiology from the Johns Hopkins Bloomberg School of Public Health.

    On his part, Ohiri holds a Master’s in Public Health from Harvard University (USA) and another Master’s degree in Public Policy from Harvard’s Kennedy School of Government.

    His career includes service at the World Bank, McKinsey & Company, and contributions to the reform of the United Kingdom’s National Health Service (NHS).

    Ajuri Ngelale, President Tinubu’s media adviser, said the appointments are with immediate effect.

    Ohiri’s profile as obtained from Gavi’s website reads, “A public health physician and health policy adviser, Kelechi Ohiri is Gavi’s Chief Strategy, Policy & Innovation Officer. In this role, he oversees a portfolio that includes Gavi’s work on policy, vaccine programmes, health system & immunisation strengthening, and immunization financing & sustainability.

    “From 2020–2023, Kelechi served on Gavi’s Programme and Policy Committee (PPC), which assists the Board in the programmatic and policy oversight of the Vaccine Alliance; from 2021–2023, he also served on the Partnerships Team.

    “Before joining Gavi, Kelechi was Chief Executive Officer of Health Strategy and Delivery Foundation, an Africa-focused, not-for-profit public health advisory firm; and a visiting scientist at Harvard University. He also co-founded both the Healthcare Leadership Academy which provides leadership and management training to clinicians and policymakers; and the Africa-focused social impact investment and advisory firm Flint Atlantic. In Nigeria, Kelechi served as senior adviser to two Ministers of Health and to a Minister of Finance; and he led the delivery of several large-scale programmes in the country, including the Saving One Million Lives initiative, and the design of the National Social Safety Net Program.

    “Prior to this, Kelechi was with the London office of McKinsey & Company, working with public and private sector clients in Europe and Africa. He has also held positions with the World Bank Group, focusing on social protection, and strengthening health systems in Asia and the Middle East. He has written policy papers and peer-reviewed articles; and he has co-authored books on health systems. Kelechi has served on several global expert advisory committees and on the Board of the World Health Organization’s Alliance for Health Policy and Systems Research.

    “Kelechi earned a medical degree from the University of Lagos. He also holds a Master of Public Health degree and a Master of Science degree in Health Policy and Management, both from Harvard University. He is a Desmond Tutu Fellow of the African Leadership Institute and a member of the Aspen Global Leadership Network.”

    Source

  • Fact Check: Chris Christie’s math on apprehensions and detention space is mostly right, but omits context

    Republican presidential candidate Chris Christie said he is open to a plan to supply financial aid to Israel, Ukraine and other countries, but he would want to see help for the southern border, too.

    Christie said in an MSNBC interview Oct. 18 that more resources are necessary to “fix the border problem.”

    “The crisis at our southern border is significant. And you know the fact is it’s a complicated issue, as you know,” Christie said. “In the last 11 months, Customs and Border Patrol has averaged 200,000 apprehensions a month, and you know how many beds we have to detain people at the border? 38,000.”

    Christie’s numbers are on track, but his statement ignores nuance.

    On Oct. 20, the Biden administration released a proposal of almost $106 billion in overall spending, including $61 billion in military aid for Ukraine, $14 billion in military aid to Israel, and $14 billion for U.S. border security.

    Word choice makes a difference

    To evaluate Christie’s comment, we examined Customs and Border Protection data from October 2022 to August 2023, the latest data available.

    Christie used the term “apprehensions,” which happens when immigration officials stop immigrants at the border under immigration law. Using this metric, there were an average of 149,238 apprehensions a month at the southern border from October 2022 to August 2023.

    To support Christie’s claim, a campaign spokesperson pointed us to CBP’s “encounters” data, which includes apprehensions and expulsions under a public health policy that expired in May. 

    From October 2022 to August 2023, there were an average of 200,549 encounters at the southern border, both at and between ports of entry.

    Both numbers represent events, not people. For example, one person could try coming into the country multiple times, and each attempt would be recorded.

    What is U.S. detention capacity?

    Immigrant detention is complicated and can involve multiple agencies. When people are apprehended at the border, Border Patrol agents temporarily take them into custody as they decide on next steps. There’s enough room for about 21,000 people a day, but overcrowding is common. 

    Border Patrol transfers some people from temporary border facilities to detention centers operated by Immigration and Customs Enforcement across the country.

    Historically, there hasn’t been enough detention space for all the migrants who cross the southern border. This kind of congressional funding hasn’t come through in more than 40 years, said Aaron Reichlin-Melnick, policy director at the American Immigration Council, an immigrants’ rights advocacy group.

    Christie slightly overstated the number of detention beds funded by Congress for fiscal year 2023, which ended in September. It was 34,000. His campaign sent PolitiFact a March article from The New York Times citing this number.

    However, the number of detention beds Congress appropriates “is generally a floor, not a ceiling,” Reichlin-Melnick said.

    In September, there were 35,289 people in ICE detention.

    Not everyone can be detained

    There’s merit to Christie’s point that there isn’t enough detention space for every single person apprehended at the border, said Colleen Putzel-Kavanaugh, a policy analyst at the nonpartisan Migration Policy Institute. 

    But for eight of the 11 months in Christie’s claim, many people encountered were quickly expelled and wouldn’t have been detained.

    Also, focusing only on the number of people at the border or detention capacity space “ignores some of the complications or the nuances” of immigration policy, said Putzel-Kavanaugh.

    That’s because even if there was enough detention space for 200,000 people, not everyone could be detained.

    For example, children traveling alone cannot legally be detained by immigration authorities. Instead, the Office of Refugee Resettlement takes custody of them.

    Under the Biden administration, families are also not detained. So if families are allowed to stay in the U.S. to seek asylum, they are often released under an alternative program in which their location is monitored by technology such as GPS, an ankle monitor or facial recognition. About 195,000 people are enrolled in these programs, according to ICE data.

    People can be released to wait for their court proceedings without any tracking technology. 

    The Border Patrol usually decides to transfer people who are going to be quickly removed from the U.S. or who pose a threat to national security into ICE detention, said Putzel-Kavanaugh. 

    Some people spend a few days in ICE detention as they wait for a repatriation flight. But others can be detained for years as they wait for an immigration judge to hear their cases.

    Our ruling

    Christie said, “in the last 11 months, Customs and Border Patrol has averaged 200,000 apprehensions a month, and you know how many beds we have to detain people at the border? 38,000.”

    Christie’s numbers are slightly exaggerated, but he’s on the right track.

    In the past 11 months for which there is data, there were an average of 149,238 apprehensions at the southern border a month. Christie was referring to a broader category of 200,549 encounters, which includes apprehensions and expulsions.

    Christie slightly overstated the number of ICE detention beds, which is 34,000. 

    Christie’s statement requires further context. Historically, Congress has not allocated enough funds to detain every immigrant who crosses the southern border. Not everyone who is stopped at the border can be detained under immigration laws and policies, including children traveling alone.

    Christie’s statement is accurate but needs clarification or additional information. We rate it Mostly True.


    Source

  • When booking a cruise, here’s how to choose less scary destinations – Paradise Post

    Halloween or any time of year, tourists who are too relaxed while on vacation may be subject to more tricks than treats due to evil that walks among us or lurks in the shadows. As sure as well wishes of “safe travels” by loved ones cannot be guaranteed in this topsy-turvy world, a momentary lapse of awareness in the presence of unsavory souls can be the difference between a trip as sweet as Skittles or as sour as Lemonheads.

    Still in our Debbie Downer costume, we must note that cruise vacations are not exempt from holiday hazards at the hands of heisters, or worse. While it’s almost always smooth sailing for passengers onboard, conditions onshore can get choppy if one isn’t cautious.

    The Department of State's travel advisory list indicates smooth sailing in and around near-trouble-free Australia. Here, a Carnival ship heads toward Brisbane. (Photo by David Dickstein)
    The Department of State’s travel advisory list indicates smooth sailing in and around near-trouble-free Australia. Here, a Carnival ship heads toward Brisbane. (Photo by David Dickstein)

    Whether arriving by land, air or sea, tourists are prime targets for crime because they typically carry fat wallets and other personal valuables while being distracted. Lacking in the local landscape, language or culture adds to a visitor’s vulnerability. Those coming by ship can be more at risk because they are typically less likely to report an incident so not to eat into their fleeting time in port.

    Scary stuff, but consulting with a travel advisor named Uncle Sam in advance of your trip could quell some nerves. The U.S. Department of State offers country-specific safety and security information at www.travel.state.gov/destination. The Bureau of Consular Affairs’ travel alerts and advisories are especially beneficial when choosing a cruise itinerary. Looking at voyages to the Caribbean that include calls to Roatan and Puerto Quetzal? Popular as these stops in Honduras and Guatemala are, respectively, the U.S. government strongly suggests you think otherwise as rampant crime is a chief reason both countries at press time were at Level 3, the tier that comes with the warning of “reconsider travel.”

    Petty crime is reportedly prevalent in Ocho Rios and other Jamaican cruise ports. (Photo by David Dickstein)
    Petty crime is reportedly prevalent in Ocho Rios and other Jamaican cruise ports. (Photo by David Dickstein)

    Not everything is “irie” in Jamaica, either, as the local slang for “all right” contradicts alarming crime statistics that earn the home of three of the most popular ports in the Western Caribbean — Montego Bay, Falmouth and Ocho Rios — the second-most severe level. Jamaica is notorious for its reckless drivers, sketchy tour guides and aggressive vendors whose wares aren’t necessarily the kind allowed back on the ship.

    The fact that cruise lines go where trouble follows, sometimes several times a day at a single port considered high risk by the U.S. government, isn’t lost on maritime lawyer and TikTok star Spencer Aronfeld (www.aronfeld.com).

    Low on crime and high on relaxation, Saint Martin/Sint Maarten, a Caribbean island shared by the French and Dutch, gets Level 1 status by the U.S. government. (Photo by David Dickstein)
    Low on crime and high on relaxation, Saint Martin/Sint Maarten, a Caribbean island shared by the French and Dutch, gets Level 1 status by the U.S. government. (Photo by David Dickstein)

    “Cruise lines have an obligation to keep passengers safe, and yet they still make calls in countries and port neighborhoods deemed dangerous to visit by the State Department,” said the Miami-based Aronfeld. “Every season, tens of thousands of passengers are dropped off in ports in Level 3 countries without warning. What the cruise lines are doing in the process is lulling people with a false sense of security.”

    There is no specter of sugarcoating where the current fighting between Israeli and Hamas forces is involved. Since the latest war in the Middle East broke out on Oct. 7, cruise lines making calls to the Israeli ports of Ashdod and Haifa have either canceled voyages outright or altered itineraries to send ships elsewhere in the Mediterranean. Celebrity, Holland America, MSC, Norwegian, Oceania, Princess and Regent Seven Seas are among the cruise lines that have announced schedule changes effective through at least November, if not the indefinite future.

    While no place is 100% safe, dozens of cruise favorites around the globe are in solid standing with the bureau and other influencers that publicly track crime statistics. Level 1 countries that roll out the welcome mat on gangways include Argentina, Australia, Barbados, Bermuda, British Virgin Islands, Canada, Cayman Islands, Curacao, French Polynesia, French West Indies, Greece, Hungary, Iceland, Malta, New Zealand, Norway, Portugal, Saint Kitts and Nevis, Saint Lucia, Singapore and Sint Maarten/Saint Martin (so, the Dutch and French sides of the island).

    Cayman Islands, considered the safest Caribbean country for visitors, is graced by a string of inviting resorts along Seven Mile Beach. (Photo by David Dickstein)
    Cayman Islands, considered the safest Caribbean country for visitors, is graced by a string of inviting resorts along Seven Mile Beach. (Photo by David Dickstein)

    With more than a million visitors in post-pandemic 2022, nearly 75% arriving by ship, George Town in Cayman Islands is the busiest international cruise port in a Level 1 country. And why not? Cayman has stunning tropical beaches, world-class luxury resorts, superb food and extremely low crime that many contribute to the nation’s high quality of life. At the Westin Grand Cayman Seven Mile Beach Resort & Spa, for example, a perfectly sunny day this past summer was made even more idyllic when not a single peddler or suspicious character shared the white sandy shore with us holiday makers — a rarity in the Caribbean, where on most beaches the wise don’t all go into the ocean together; someone must always stay back to mind the stuff.

    As tourists take fun photos at the Leaning Tower of Pisa, thugs could be focused on taking other things. (Photo by David Dickstein)
    As tourists take fun photos at the Leaning Tower of Pisa, thugs could be focused on taking other things. (Photo by David Dickstein)

    Destinations given Level 2 status come with an “exercise increased caution” advisory. Mexico is on that sublist mostly due to such violent crime as homicide, kidnapping, carjacking and robbery, which the U.S. government says is “widespread and common” south of the border. Turkey also was at Level 2 at press time, but for different reasons; the government considers it a target for terrorism. The average tourist, however, is more likely to encounter snatching and pickpocketing within the country’s economic and cultural capital of 16 million people; frenetic Istanbul is a common stop on Mediterranean cruise itineraries. Venice is in the same gondola. Petty crime against visitors is a big issue there, which makes wearing a money belt as smart as getting gelato where the longest lines are. Rome, Florence, Pisa, Naples and even Vatican City are other havens for unsaintly activity in and around Italy. Infamous as Italy is for its petty crime on tourists, the main reason the country is at Level 2 is, like Turkey, the threat of terrorism.

    Not all nations share the same dangers, of course, but each does have its good and bad sections — something that the State Department’s travel advisories don’t often factor in. After all, if the United States was listed, would it be fair for Honolulu, considered the safest American city with over 300,000 people, to be lumped in with St. Louis, supposedly the most dangerous? If it were, all of America would likely be at Level 2 or 3. The U.S. Department of State does issue a warning for one domestic cruise destination: While in Puerto Rico, travelers are advised to take necessary precautions to avoid such petty crimes as theft and muggings. Like on the mainland, PR also has its share of public protests, something else to avoid.

    Tourists are advised to stay away from public protests, even on American soil in Puerto Rico. (Photo by David Dickstein)
    Tourists are advised to stay away from public protests, even on American soil in Puerto Rico. (Photo by David Dickstein)

    The U.S. government’s one-size-fits-all approach for its advisories effects cruise mainstay Haiti as well. The country is assigned to the same Level 4 (“do not travel”) category as Russia, Ukraine, North Korea, Iraq and Iran, but several cruise lines operate private destinations there. These private islands, as they’re called, are regarded as some of the safest places in the world for shore excursions. That why it’s probably best to heed these travel advisories, but not as gospel. To wit, Jeddah is an up-and-coming cruise port in Saudi Arabia — the region is rich in UNESCO World Heritage archaeological sites — and while reported crime on tourists is low there, the country, itself, is at Level 3. Justification for the harsh ranking is an apparent threat of missile and drone attacks on civilian facilities, but the hot zones indicated by the State Department are far from Jeddah and likely inconsequential to cruise ships.

    “I know it might be hard for Americans to believe, but Jeddah is one of the world’s safest ports,” said maritime lawyer Aronfeld. “They don’t have the same day-to-day crime that tarnishes so many otherwise amazing cruise destinations.”

    Whether traveling to Montego Bay, Newport Bay or anywhere on holiday, taking a few precautions can make a globetrotting world of difference. Here are some common-sense tips for safekeeping:

    • Be extra cautious where and when risks are moderate to high.
    • Avoid isolated areas and travel in groups when possible.
    • Leave valuables in your stateroom or hotel safe, and what you do wear or carry should always be secured, if not inconspicuous.
    • Two words: money belt.
    • Two more words: drink responsibly.
    • Go on YouTube and TikTok to familiarize yourself with local scams.
    • Have local emergency numbers handy including your country’s nearest embassy or consulate.
    • When personal safety could be at risk, ask yourself, “Is it worth it?”
    • Trust your instincts.

    Safe travels!

    Source

  • BREAKING: Shaakaa Chira Named New Auditor-General

    The-Whistler-NG-Breaking-News

    President Bola Tinubu has appointed a new Auditor-General of the Federation in the person of Shaakaa Chira.

    His appointment comes more than a year after the country’s former Auditor-General, Ahmed Idris, was suspended in connection with a N109 billion money laundering allegation.

    Idris alongside three others – Godfrey Olusegun Akindele, Mohammed Usman and Gezawa Commodity Market and Exchange Limited – are being tried at the Federal Capital Territory (FCT) High Court.

    President Tinubu’s media adviser, Ajuri Ngelale, said his principal appointed Chira to succeed Idris as substantive Auditor-General based on recommendation of the Federal Civil Service Commission (FCSC) and in line with the “powers vested in him by Section 86 of the 1999 Constitution (Amended)”.

    Ngelale added, “The President approved Mr. Chira’s appointment after the Federal Civil Service Commission (FCSC) conducted a screening exercise that identified Mr. Chira as the most qualified candidate who had also scored the highest in the examination amongst all qualified candidates for the office.

    “President Bola Tinubu expects the new Auditor-General to justify the confidence reposed in him and to live up to the high expectations that Nigerians have concerning the execution of the Renewed Hope Agenda of his administration.”

    Source

  • Fact Check: Video on ‘American Debt Relief’ program misleads

    Debt among American households reached a record high at the end of 2022. And promises to get it relieved are tempting.

    A Facebook post claims to show a family receiving news that their own debt had been cleared through a debt relief program for American citizens or legal residents who “have over $20,000 in (credit card) debt.”

    Footage shows the family screaming with joy after appearing to view an email that says its $31,844 credit card balance has been resolved and that “no further payments are due.” The sender of the email signs as “Finance Help USA.”  

    This post was flagged as part of Meta’s efforts to combat false news and misinformation on its News Feed. (Read more about our partnership with Meta, which owns Facebook and Instagram.)

    First, the family in the video is not screaming over debt relief. That scene appears to be clipped from a 2019 TikTok video showing a prospective Tulane University student receiving news of her acceptance. It is set against a split screen showing video of the supposed debt-relief email. Her video went viral and became a meme.

    Second, the post refers to something called the “American Debt Relief” program, which sounds like a federal government program, but isn’t. The Federal Trade Commission  recommends consumers who see these kinds of pitches check whether the associated website ends in “.gov,” which signifies that it is legitimately a federal government program, an agency spokesperson said. In this case, it doesn’t.

    Nick Hillman, University of Wisconsin-Madison education professor who studies the effect of finance, policy and geography on educational opportunities in the U.S., said that “the word ‘relief’ can be really confusing and misleading because I imagine most people would think ‘relief’ is the same thing as ‘cancellation.’”

    The Facebook post includes a link to this page from a private company called Freedom Debt Relief. Debt settlement companies such as this one, help resolve debt to avoid bankruptcy, by negotiating agreements with creditors to pay less than the full balance. In exchange, customers pay a fee for the service. 

    These companies normally negotiate unsecured debts such as student loans or credit card debt, but not loans that have collateral, such as auto loans and mortgages.

    Hillman said, “The refinancing process may provide ‘relief’ by offering borrowers lower interest rates or possibly other benefits, but these also come at a risk.” For example, if a borrower refinanced a federal student loan to a private company such as SoFi, that borrower would lose all the benefits that come with holding a federal loan.

    The Facebook post saysr the minimum debt to apply for the program is $20,000, but the company accepts people with debts starting at $7,500. 

    The Freedom Debt Relief website includes a disclaimer that says, “We do not assume your debts, make monthly payments to creditors or provide tax, bankruptcy, accounting or legal advice or credit repair services.”

    Our ruling

    A Facebook video claims to show a family receiving word their debt has been resolved through the “American Debt Relief Program,” which purportedly aids American citizens and legal residents who “have over $20,000″ in credit card debt.”

    But this video was clipped from a TikTok video that showed a family responding to news of a college acceptance. We found no federal program called the American Debt Relief Program. The post leads to a debt settlement company that does not wipe out debt but, for a fee, negotiates with creditors to let borrowers pay less than they owe.

    We rate this claim False.


    Source

  • Native lands lack clean water protections, but more tribes are taking charge – Paradise Post

    Alex Brown | (TNS) Stateline.org

    Across the roughly 1,300 square miles of the White Earth Indian Reservation in northwest Minnesota, tribal members harvest wild rice in waters that have sustained them for generations. They’ve been working for decades to restore sturgeon, a culturally important fish, and they harvest minnows and leeches to supply bait for anglers across the country.

    But the White Earth Band can no longer depend on the clean, abundant waters that make those activities possible. Droughts brought on by climate change and irrigation for agriculture have threatened the reservation’s rivers and lakes. Manure runoff from factory farms could poison the water that’s left.

    Last year, the tribal government passed an ordinance to restrict withdrawals of water from the reservation and adjacent lands that share an aquifer. Under the statute, farms and other businesses seeking to withdraw more than 1 million gallons per year must obtain a permit from the tribe.

    “White Earth firmly believes that if they did not take this action, the health and well-being of their members would be imminently harmed,” said Jamie Konopacky, the tribe’s environmental attorney. “Because of the growing concern about massive water appropriations, they passed this ordinance to give themselves independent permitting authority.”

    The tribe’s action has not stopped the state from issuing water withdrawal permits on reservation land, a dispute currently being contested in tribal court. While the legal battle is with a farmer, not the state, Minnesota officials are examining the jurisdictional issues in play, and the tribe is urging them to recognize its sovereignty.

    White Earth leaders are joining a growing effort by tribal nations to protect waters in Indian Country — asserting their sovereignty to target pollution that’s threatening wild rice in Minnesota, shellfish in Washington and salmon in California.

    Some of the nations have passed tribal ordinances to regulate polluters on reservation lands. Others have sought authority under the federal Clean Water Act to establish their own water quality standards, giving them a legal mechanism to combat pollution coming from upstream.

    “The tribe’s treaty right to harvest and consume shellfish and finfish is not a meaningful right if they’re not safe to eat,” said Hansi Hals, natural resources director for the Jamestown S’Klallam Tribe on Washington state’s Olympic Peninsula.

    Last year, the U.S. Environmental Protection Agency gave the Jamestown S’Klallam Tribe approval to issue its own water quality standards under the Treatment as a State (TAS) program. That status essentially gives tribes the same regulatory power over certain water quality programs as states, once they have proven their jurisdiction on waters that run through or connect to reservation and tribal trust lands. The tribe plans to adopt standards under that authority sometime next year.

    Meanwhile, the EPA is working to establish “baseline” water quality standards for tribes that have not yet adopted their own, ensuring that all Native lands receive Clean Water Act protections.

    As tribes establish their own standards and permitting programs, some experts believe they could play a critical role in fighting pollution and ensuring that the resources they depend on for subsistence and cultural values are preserved.

    But tribal leaders acknowledge that regulatory programs are expensive and time-consuming to establish, and some tribes can’t afford them. And many tribes that seek to assert their sovereignty risk costly legal battles with industry-friendly states, which are reluctant to give up their own permitting authority. Meanwhile, a new presidential administration could appoint EPA leaders hostile to tribal interests, undoing recent efforts.

    Asserting sovereignty

    In 1987, Congress passed a provision allowing tribes to set their own water quality standards in the same manner as states, recognizing that Native reservations had been left out of the powers delegated to states under the Clean Water Act.

    “Clean Water Act standards don’t exist in Indian Country,” said Jim Grijalva, a professor at the University of North Dakota School of Law and a longtime advocate for tribal water programs. “The problem is a racist assumption that tribes shouldn’t have the governmental right to do anything.”

    While the Treatment as a State program sought to correct that, its lengthy and complicated approval process has made it challenging for tribes to pursue that option. Only 84 of the nation’s 574 federally recognized tribes are recognized under the TAS program. And only 326 tribes have reservation land, further limiting the nations that can apply.

    But momentum is growing. A 2016 EPA rule streamlined the application process, and 22 tribes — more than a quarter of those approved — have earned TAS status since 2020.

    “The learning curve has been slow at times, but tribes are realizing the ability to use their sovereign authority under the Clean Water Act as part of their arsenal for protection,” said Ken Norton, chair of the National Tribal Water Council, a tribal advocacy group.

    Norton also directs the Tribal Environmental Protection Agency for the Hoopa Valley Tribe in California, which was among the first tribes approved for TAS status in 1996. The tribe’s regulatory authority on the Klamath River enabled it to negotiate the extension of a state-run salmon hatchery that was slated to close under a dam-removal plan.

    “Our voice at the table, not as a stakeholder but as a regulatory entity, was strengthened because we had these federally approved water quality standards,” Norton said.

    Grijalva, the law professor, noted that tribal standards can take into account factors such as the dietary habits of Native people who harvest food from the landscape.

    “Tribes have inherent rights to make value judgments that are different than their neighbors,” he said. “If you set a dioxin standard, mercury standard or selenium standard based on risk to the average white guy, you’re not accounting for the tenfold increase in exposure to an Indigenous person.”

    In Michigan’s Upper Peninsula, members of the Keweenaw Bay Indian Community fish for lake trout, brook trout and walleye on the reservation’s lakes and rivers. The tribe earned TAS status in 2020 and is working to issue water quality standards by the end of the year.

    “We’re a fishing community, so the protection of water quality is of utmost importance,” said Dione Price, the tribe’s environmental specialist and environmental health section lead. “This really does give the tribe a seat at the table in water protection.”

    The Karuk Tribe in California also received TAS approval in 2020. Grant Johnson, the tribe’s water quality program manager, said that step came after years of securing funding, hiring staff and building proficiency to ensure it could craft detailed regulations, monitor its waters and enforce its standards.

    The Keweenaw Bay and Karuk tribes are among the 37 nations that have received TAS authority but are still working to issue water quality standards or waiting on EPA approval of those thresholds. While many are well underway, the staffing levels and expertise required to run a water quality program remain a major hurdle for some tribes.

    “It’s great to take advantage of the politically open moment, but many tribes don’t have the resources and support to make their own standards,” said Sibyl Diver, a lecturer at Stanford University’s Earth Systems Program who has published research on TAS.

    Diver also noted that many reservations are within states that are hostile to tribal sovereignty and environmental regulations. Such tribes are likely to face lawsuits from state governments and conservative groups, and may not have the resources for expensive legal battles.

    New authorities

    While many tribes have set standards that are more stringent than their neighbors, experts say that even thresholds that only match federal minimums give tribes a major tool. Just by holding that authority, tribes can participate in permitting decisions on upstream waters.

    For the Chehalis Tribe in Washington state, water quality standards allow it to protect the salmon that swim in the Chehalis River.

    “The tribe having its own standards means that if there’s a project or an issue that’s happening upstream, the tribe now has a say in what’s happening rather than waiting for the federal government to act on it,” said Jeff Warnke, the tribe’s director of government and public relations.

    While more tribes work toward that regulatory power, others have started by setting tribal ordinances for their own reservations. Some, like the White Earth Band in Minnesota, see the establishment of an internal program as a precursor for pursuing TAS authority. Norton, with the National Tribal Water Council, said more tribal nations have issued such regulations in recent years, although specific figures are hard to come by.

    Meanwhile, more tribes may seek to create or expand water ordinances after the U.S. Supreme Court’s ruling earlier this year to remove millions of acres of wetlands from Clean Water Act jurisdiction, leaving their protection up to states and tribes.

    As more tribes work to set up their own programs, the EPA has proposed a “baseline” water quality standard for tribal lands that are not yet covered under TAS. If the rule moves forward, it would provide protection for 76,000 miles of rivers and streams and 1.9 million acres of lakes and reservoirs that currently lack standards, the agency said.

    “Some states like the fact that there’s no rules in Indian Country,” said Grijalva, the law professor. “But if a significant part of the country is not protected because it doesn’t have the most basic water quality standards, EPA isn’t doing its job.”

    The federal agency did not make a spokesperson available for comment.

    Stateline is part of States Newsroom, a national nonprofit news organization focused on state policy.

    ©2023 States Newsroom. Visit at stateline.org. Distributed by Tribune Content Agency, LLC.

    Source

  • We Will Invest In Health Sector To Make It Globally Competitive — Soludo

    The Wife of Anambra State Governor, Mrs Nonye Soludo has said the state will aim for the first position in the next under-5 Mortality Ranking in Nigeria.

    Anambra State was ranked second behind Lagos state in the latest United Nations International Children’s Emergency Fund (UNICEF) and BudgIT Nigeria.

    It placed the state’s Under-5 Mortality rate at 22 per every 1000 births, which is few points behind Lagos.

    Soludo while reacting to the ranking said it is a boost for the state in its bid to achieve near zero on infant and maternal deaths.

    She said: “Glad to announce that our dear Anambra State has just been ranked second as the state with the least Under-5 Mortality figures in Nigeria. This is a massive boost for us in the advancement to achieve a near-zero count on infant and maternal deaths in line with the targets of the Sustainable Development Goals (SDGs).”

    She maintained that the present government will aim to rank first in subsequent rating and will invest more in it’s health sector.

    “While we aim to rank first in subsequent ratings, we’ll continue to invest in the strength of our health sector to make it globally competitive” she concluded.

    Source

  • Ousted SF Giants manager interviews for top Red Sox job: report

    It’s been three weeks since the Giants fired Gabe Kapler, but their ousted manager may not be out of the game for long.

    Kapler has reportedly begun interviewing for other jobs, and he’s not limiting himself to other open managerial positions.

    According to the Boston Globe, the former Giants manager met with Red Sox officials about the top job in their baseball operations department, a position vacated last month when they fired Chaim Bloom. Boston has reportedly had trouble filling the role, with members of multiple front offices declining interview requests.

    Only two years removed from being named the National League manager of the year, Kapler would have to make the rare jump from an on-field role into a front office. But before he was hired as a manager for the first time in Philadelphia, he gained experience in the Dodgers’ front office as their farm director for three seasons.

    Source

  • Your Rights To Admission Will Not Be Denied, JAMB Assures UNILAG Applicants

    unilag-logo-

    The Joint Admissions and Matriculations Board (JAMB) has assured fairness and equity in resolving the admission procedural issue with the University of Lagos (UNILAG).

    The Board was reacting to an online publication that alleged that some admission applicants were being denied admission in the University of Lagos because of JAMB’s failure to upload WAEC results on the portal.

    A statement signed JAMB spokesperson, Dr. Fabian Benjamin assured candidates involved in the issue of JAMB’s intervention, adding that their right to admission, if qualified, would not be denied.

    “Consequently, all those who uploaded at the right time on Central Admissions Processing System (CAPS), and ranked appropriately would be considered by the University as stated by relevant advisories,” Benjamin said.

    He called on candidates, especially high-scoring ones, who were not offered admission and strongly feel they merit such, to take advantage of the Board’s complaints platform and raise requisite tickets as their complaints would be looked into expeditiously and resolved.

    “ If their application is deemed unsuccessful, they would be provided with sufficient reason(s), if any, why they were not considered for admission. And where they had been unjustly denied their due rights, provided they have met all ranking requirements, the Board would ensure that they obtain redress,” he said.

    While explaining the processes of the admission, JAMB spokesperson said: “First, the Board would want to state clearly that its Central Admissions Processing System (CAPS), a platform on which all admissions are conducted and through which candidates are expected to upload their O/level results, was established to engender transparency and accountability in the admission process.

    “Furthermore, resolving candidates’ complaints with respect to their admission status is a major component of the software, which was introduced to ensure that no candidate is denied admission unjustly.

    “One of the major provisions of the platform and others like the Ticketing platform is their capacity to empower candidates to interact directly with the Board with a meticulous record of such interactions archived and generating an electronic trail that all operators could access to ascertain the true position of things should any dispute arise.

    “As a regulator, one of the central responsibilities of the Board to candidates and other stakeholders is to ensure that no candidate, who is qualified to be admitted is denied such admission, hence the several provisions by the Board for candidates to always raise queries when they feel shortchanged.”

    He stated that the process of admission requires candidates to upload their O’Level results on the CAPS platform, among others, to determine their eligibility for tertiary education.

    “ To ensure wider access, candidates are, at the point of registration, allowed to register with ‘Awaiting Result’ but such results being awaited must be uploaded before the commencement of admission by their chosen institution otherwise, they would be deemed unqualified,” it said

    Benjamin added that candidates, who upload their O’Level results after the stipulated time for consideration of admission, stand no chance even when they eventually upload such results or petition their choice institutions.

    “However, no candidate should be left out if he/she uploads within the stipulated time and is ranked amongst qualified candidates in any particular course of study.

    “To facilitate this, the CAPS tracking facility indicates the date, time and even seconds that such results were uploaded and, as such, provides incontrovertible evidence in the event of disputes,” he said.

    He said that some candidates, through the “Ticketing Platform” of the Board, queried their failure to get admitted positing that by virtue of their ranking on the platform, they ought to be admitted.

    “Their claim is being investigated to ascertain their veracity with such universities being engaged to arrive at a just and equitable outcome. At the end of the investigations, it is our belief that justice would be seen to have been done.

    “The Board as a responsible and responsive agency has, over the years, ensured that institutions admit candidates even where they feel strongly that such candidates do not deserve such admission based on certain principles which the Board feels had not been sufficiently or clearly defined ab initio,” the statement said.

    Benjamin added that the Board would not abandon its statutory responsibility of ensuring that admission processes are monitored constantly to protect any candidate from being shortchanged.

    “To protect the interest of all candidates, the Board assigns a Desk Officer to each institution to monitor their respective admission transactions and call the attention of management to instances where fairness, equity and justice are not seen as being upheld,” he said.

    Source

  • Biden’s Numbers, October 2023 Update

    Summary

    Since President Joe Biden took office:

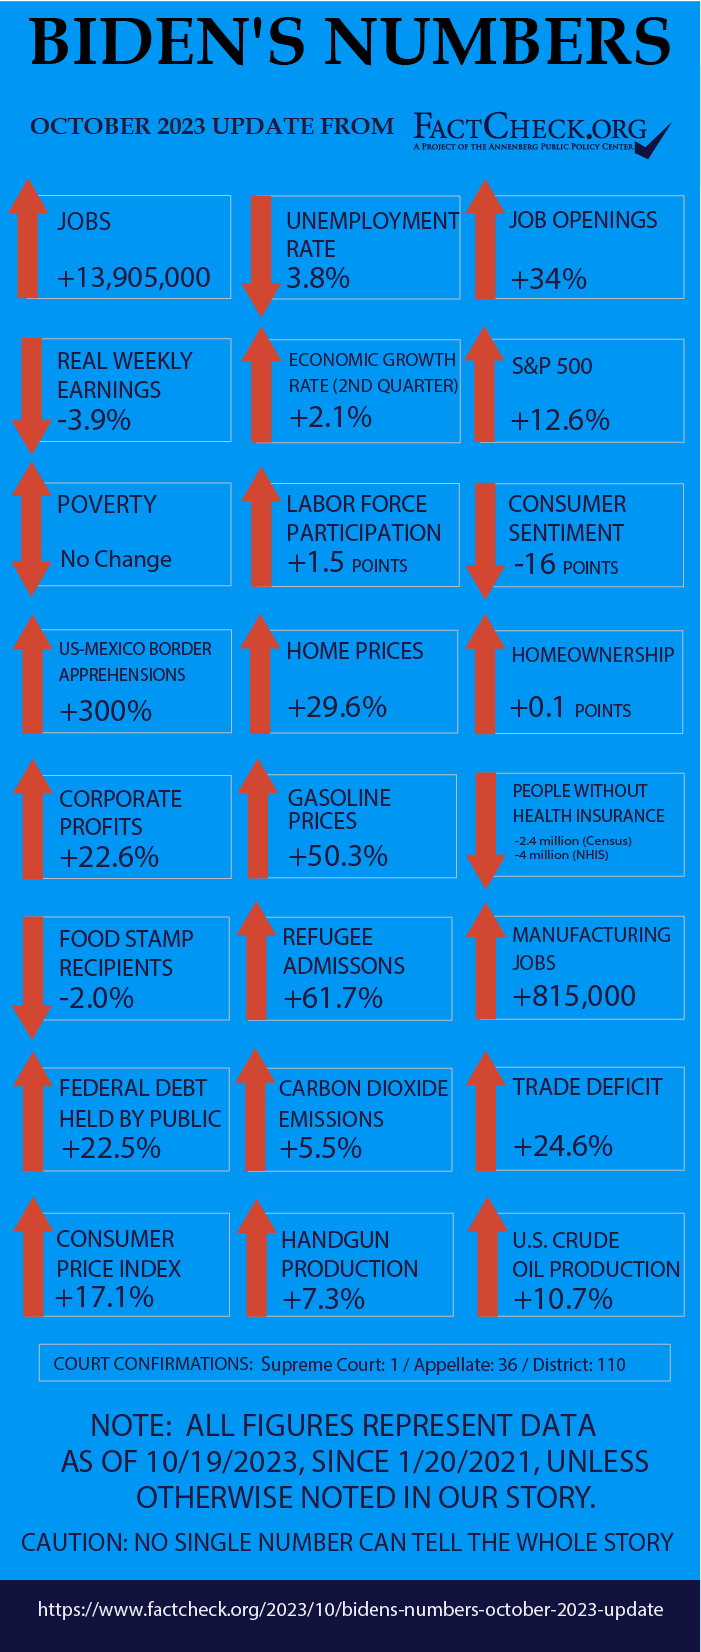
    • The economy added 13.9 million jobs, putting the total 4.5 million higher than before the pandemic.
    • The unemployment rate dropped for a time to the lowest in nearly 54 years; unfilled job openings surged, with 3 jobs for every 2 unemployed job seekers.
    • Inflation surged to the highest level in over 40 years. Despite slowing their rise lately, consumer prices are up nearly 17.1% overall. Gasoline is up 50.3%.
    • Average weekly earnings haven’t kept pace with prices. After adjusting for inflation, “real” weekly earnings dropped 3.9%.
    • The U.S. murder rate declined by one-half of a point.
    • Defying economists who have been predicting a recession for more than a year, the economy expanded at an annual rate of 2.2% in the first quarter and 2.1% in the second quarter.
    • After-tax corporate profits increased in the second quarter of this year — the first increase in a year.
    • Inflation-adjusted median household income went down by 2.7%. The official poverty rate is the same as the year before he took office.
    • Those lacking health insurance went down — by 0.7 percentage points by one measure and 1.3 points by another.
    • U.S. crude oil production is up 10.7%; imports are up 7.4%.
    • Homeownership rates have barely budged under Biden.
    • The U.S. accepted 60,014 refugees in fiscal year 2023 — the highest amount in seven years, but less than half of Biden’s campaign goal of admitting up to 125,000.
    • The number of apprehensions of those trying to cross the southern border illegally crept back up in recent months, and is up 300% overall.
    • Debt held by the public has increased by 22.5%.
    • The trade deficit for goods and services has gone up by 24.6%.

    Analysis

    This is our eighth installment of “Biden’s Numbers,” a quarterly feature we launched in January 2022. As we also did for former Presidents Barack Obama and Donald Trump, we provide the latest statistics on a range of topics from authoritative sources on what has happened in the country since the president was inaugurated.

    Opinions will vary on whether a president deserves credit or blame for these figures, and we take no position on that.

    Jobs and Unemployment

    The number of people with jobs has increased dramatically since Biden took office, surpassing pre-pandemic levels by more than 4.5 million.

    Employment — The U.S. economy added 13,905,000 jobs between Biden’s inauguration and September, the latest month for which data are available from the Bureau of Labor Statistics. The September figure is 4,503,000 higher than the February 2020 peak of employment before COVID-19 forced massive shutdowns and layoffs.

    Some categories are still lagging, however. There were 89,000 fewer public school teachers and other local government education workers in September than there were at the pre-pandemic peak, and 187,500 fewer hotel and restaurant workers and others in the accommodation and food services industries.

    Unemployment — The unemployment rate fell from 6.3% at the time Biden took office to 3.4% in January and again in April, the lowest since June 1969. Most recently the rate has crept up to 3.8% in September, or 0.3 points above the pre-pandemic rate.

    Job Openings — The number of unfilled job openings soared, reaching a record of over 12 million in March of last year, but then declined after the Federal Reserve began a steep series of interest rate increases aimed at cooling the economy to bring down price inflation.

    The number of unfilled jobs was 9.6 million as of the last business day of August, the most recent month on record. That’s still an increase of over 2.4 million openings — or 34% — during Biden’s time.

    In August, there was an average 3 jobs for every 2 unemployed job seekers. When Biden took office, there were more unemployed job seekers than job openings.

    The number of job openings in September is set to be released Nov. 1

    Labor Force Participation — One reason many job openings go unfilled is that millions of Americans left the workforce during the pandemic and haven’t returned. The labor force participation rate (the percentage of the total population over age 16 that is either employed or actively seeking work) has risen slowly during Biden’s time, from 61.3% in January 2021 to 62.8% in September.

    That still leaves the rate well short of the pre-pandemic level of 63.3% for February 2020.

    The rate peaked at 67.3% more than two decades ago, during the first four months of 2000. Labor Department economists project that the rate will trend down to 60.1% in 2031, “primarily because of an aging population.”

    Manufacturing Jobs — During the presidential campaign, Biden promised he had a plan to create a million new manufacturing jobs — and whether it’s his doing or not, the number is getting close to that target.

    As of September, the U.S. added 815,000 manufacturing jobs during Biden’s time, a 6.7% increase in the space of 32 months, according to BLS. Furthermore, the September total is 226,000 (or 1.8%) above the number of manufacturing jobs in February 2020, before the pandemic forced plant closures and layoffs.

    During Trump’s four years, the economy lost 170,000 manufacturing jobs, or 1.4%, largely due to the pandemic.

    Wages and Inflation

    CPI — Inflation came roaring back under Biden. During his first 32 months in office, the Consumer Price Index rose 17.1%.

    It was for a time the worst inflation in decades. The 12 months ending in June 2022 saw a 9.1% increase in the CPI (before seasonal adjustment), which the Bureau of Labor Statistics said was the biggest such increase since the 12 months ending in November 1981.

    Inflation has moderated since then. The CPI rose 3.7% in the 12 months ending in September, the most recent figure available.

    Gasoline Prices — The price of gasoline shot up even faster.

    During the week ending Oct. 16, the national average price of regular gasoline at the pump was $3.58. That’s $1.20 higher than in the week before Biden took office, an increase of 50.3%.

    The price swung even more wildly during Biden’s first year and a half, hitting just over $5 per gallon in the week ending June 13, 2022. That’s the highest on record. The rise was propelled by motorists resuming travel after pandemic lockdowns and then by Russia’s invasion of Ukraine on Feb. 24, 2022.

    Wages — Wages also have gone up under Biden, but not as fast as prices.

    Average weekly earnings for rank-and-file workers went up 13.1% during Biden’s first 32 months in office, according to monthly figures compiled by the BLS. Those production and nonsupervisory workers make up 81% of all employees in the private sector.

    But inflation ate up all that gain and more. “Real” weekly earnings, which are adjusted for inflation and measured in dollars valued at their average level in 1982-84, actually declined 3.9% since Biden took office.

    More recently, real wages have been inching up, rising 0.7% since hitting the low point under Biden in June 2022.

    Crime

    Both the number and rate of violent crimes, including murders specifically, have gone down under Biden, from 2020 to 2022, according to the FBI’s annual reports on nationwide crime.

    The FBI released its latest “Crime in the Nation” data, covering 2022, on Oct. 16. Its estimates show a drop in the murder and nonnegligent manslaughter rate of 0.5 points, from 6.8 per 100,000 population in 2020 to 6.3 in 2022. The number of murders declined by 5.6%, totaling an estimated 21,156 last year.

    The violent crime rate dropped by 15.4 points, to 369.8 per 100,000 population in 2022. (For these figures, see Table 1 in the CIUS Estimations download for the crime in the U.S. reports.)

    The FBI’s 2022 report is based on figures voluntarily provided by 15,724 law enforcement agencies, which represent 93.5% of the U.S. population. Last year, the FBI had an issue with a lower participation rate, because it had switched to a new crime reporting system in 2021 that many law enforcement agencies, including those in New York City and Los Angeles, hadn’t yet adopted. That made it difficult for the FBI make nationwide comparisons to prior years. But for 2022, the FBI permitted agencies that hadn’t yet transitioned to the new system to submit data in another manner. As a result, all U.S. cities with 1 million population or more provided statistics for the full year, the FBI said.

    The property crime rate also declined a bit, by 9.5 points, from 2020 to 2022. But there was a notable increase in motor vehicle thefts: The rate increased by 35.2 points to 282.7 vehicle thefts per 100,000 people.

    The decrease in murder and aggravated assaults under Biden, however, hasn’t yet brought those figures back to their 2019 levels, before an increase in both offenses during the 2020 pandemic. For instance, the 6.3 murder rate for 2022 is still higher than the 5.2 rate for 2019.

    !function(e,n,i,s){var d=”InfogramEmbeds”;var o=e.getElementsByTagName(n)[0];if(window[d]&&window[d].initialized)window[d].process&&window[d].process();else if(!e.getElementById(i)){var r=e.createElement(n);r.async=1,r.id=i,r.src=s,o.parentNode.insertBefore(r,o)}}(document,”script”,”infogram-async”,”

    Statistics from other sources reflect the same trend over the past few years, and show murders have continued to decline in 2023.

    The latest figures from the Major Cities Chiefs Association show a 10.9% decline in the number of murders for the first half of 2023, compared with the same time period in 2022, in 69 large U.S. cities.

    There was also a drop in murders in large cities in 2022. These decreases come after a 33.4% increase in the number of murders in large cities from 2019 to 2020, according to the Major Cities Chiefs Association, and a smaller 6.2% rise from 2020 to 2021, Biden’s first year in office.

    The nonpartisan think tank Council on Criminal Justice published a midyear report on 30 U.S. cities that similarly found decreases in several crimes, including homicides, for the first half of 2023, compared with the same time period last year. But it found a large increase in motor vehicle thefts: 33.5%.

    CCJ noted that despite the recent declines in homicides, the number for the first half of this year remained higher than the first half of 2019, “the year prior to the COVID pandemic and racial justice protests of 2020.”

    “The authors conclude that crime patterns continue to shift as the nation has emerged from the COVID pandemic and that policymakers and communities must act urgently to adapt their strategies to meet the new challenges,” CCJ said in a summary of its report. “Though the level of serious violent crime is far below historical peaks, it remains intolerably high, especially in poorer communities of color.”

    Economic Growth

    Economic growth has been stronger than expected, defying economists who have been predicting a recession for more than a year.

    The real gross domestic product, which accounts for inflation, increased 5.8% in 2021 and slowed to 1.9% in 2022, when some economists predicted that the country was headed for a recession.

    But the growth has continued in 2023 — albeit at a relatively slow rate.

    In a Sept. 28 release, the Bureau of Economic Analysis estimated that the economy increased at an annual rate of 2.1% in the second quarter, and BEA revised its first quarter estimate upward to 2.2% from 2%.

    The first official estimate for the third quarter of 2023 won’t be released until Oct. 26. But the Federal Reserve Bank of Atlanta’s “GDP Now” estimated on Oct. 18 that the economy will grow at an annual rate of 5.4% in the third quarter.

    In a report released last month, Sal Guatieri, a senior economist at BMO Capital Markets, said the U.S. economy now seems poised for a “soft landing” — which is the sweet spot sought by the Fed when it raised interest rates with the hope that it would slow economic growth without causing a recession.

    “We recently shifted to the soft-landing camp, as the broad strength shown in the Q2 GDP release convinced us that the U.S. economy is more durable than expected,” Guatieri writes. “Not only is it not slowing further, it might be picking up.”

    Corporate Profits

    As the fear of a recession fades, after-tax corporate profits increased in the second quarter of this year — the first increase in a year.

    Under Biden, corporate profits set new annual records in 2021 and 2022 — but declined in the last two quarters of 2022 and the first quarter of this year, according to BEA estimates. (See line 45.)

    On Sept. 28, the BEA estimated after-tax corporate profits were at an annual rate of more than $2.9 trillion in the second quarter. That was 22.6% higher than the quarter before Biden first entered the White House.

    It was the first such increase since the second quarter of 2022.

    Stephen Stanley, the chief economist at Santander Capital Markets US, told Bloomberg that the rise in corporate profits was due in part to companies that “saw a degree of relief on the cost side.”

    !function(e,n,i,s){var d=”InfogramEmbeds”;var o=e.getElementsByTagName(n)[0];if(window[d]&&window[d].initialized)window[d].process&&window[d].process();else if(!e.getElementById(i)){var r=e.createElement(n);r.async=1,r.id=i,r.src=s,o.parentNode.insertBefore(r,o)}}(document,”script”,”infogram-async”,”

    Consumer Sentiment

    Despite improving economic trends, consumer confidence in the economy has fallen since our last report. 

    The University of Michigan’s Index of Consumer Sentiment dropped in the past two months. The October preliminary index was 63 — down from 68.1 in September and 71.6 in July.

    The latest preliminary number was 16 points lower than it was when Biden took office in January 2021.

    In a Sept. 8 report, Joanne Hsu, director of the Surveys of Consumers, said “while consumers have welcomed the slowdown in inflation in 2023, concerns over interest rates have emerged.”

    Income and Poverty

    Household income — Household income declined again during Biden’s second year in office.

    According to Census Bureau estimates published in September, real median household income was $74,580 in 2022. When factoring in inflation, that was a decrease of $2,080, or 2.7%, from 2020.

    It also was the third straight annual decrease, after median household income declined by $1,590 in 2020 and $330 in 2021.

    (The median figure represents the midpoint — half of all households earned more, half less.)

    Before 2020, real median income had reached $78,250 in 2019, the highest amount on record, according to the bureau’s inflation-adjusted figures.

    Poverty — Meanwhile, the official poverty rate — which is based on an individual’s or family’s pretax cash income — went down by 0.1 percentage point, from 11.6% in 2021 to 11.5% in 2022, according to the Census Bureau’s most recent estimates. The 2022 rate was flat with the 2020 rate, which also was 11.5%.

    As for the raw numbers, there were about 37.9 million people below the poverty line in 2022, which was about 370,000 more than in 2020.

    However, the Census Bureau’s alternative estimate, the Supplemental Poverty Measure, showed an increase in poverty last year.

    Unlike the official poverty rate, the SPM, which was introduced in 2011, factors in government programs that benefit low-income families and individuals, such as food, housing and energy assistance, as well as tax credits and stimulus payments. The SPM also considers other mandatory expenses and regional differences in the cost of living.

    In 2022, the supplemental poverty rate was 12.4% — up from 7.8% in 2021, 9.2% in 2020 and 11.8% in 2019, before the pandemic. The 2022 rate “was the first significant increase in the SPM rate since 2010,” Census said.

    And that increase, according to Census economists, “was largely the result of the end of stimulus payments and tax credits in effect during the COVID-19 pandemic that had lowered the SPM rate to its lowest level ever in 2021.”

    Children, out of all age groups, were most affected by the expiration of those pandemic-related benefits, which included a one-year expansion of the child tax credit in 2021. The SPM child poverty rate increased by 7.2 percentage points, from 5.2% in 2021 to 12.4% in 2022, according to the poverty report.

    Biden has said he will “fight to restore the expanded Child Tax Credit” that congressional Republicans opposed reauthorizing. Census said that the fully refundable child tax credit had prevented about 5.3 million children from falling into poverty in 2021, “over twice as many” people as the pared back version did in 2022.

    Health Insurance

    The number of people without health insurance has decreased by 0.7 percentage points or 2.4 million people under Biden. Those figures come from the Census Bureau’s annual reports, which measure those who lacked insurance for the entire year.

    In 2020, the year before Biden took office, 28.3 million people, or 8.6% of the population, lacked health insurance for the entire year. In 2022, 25.9 million people, or 7.9% of the population, didn’t have insurance, according to the Census Bureau reports, which are typically published in September.

    Another government survey, the Centers for Disease Control and Prevention’s National Health Interview Survey, measures the uninsured at the time they were interviewed, and by that metric, the drop is greater. The NHIS shows those without health insurance declined by 1.3 percentage points, or 4 million people, from 2020 to 2022.

    More recent estimates from the NHIS indicate the share of the population without insurance continued to go down in the first three months of 2023. But as we have noted before, it’s possible the uninsured figures will go up this year, since some Medicaid provisions that were enacted during the coronavirus pandemic started to be phased out at the end of March.

    The Census Bureau’s annual reports show that most Americans have insurance through their employers — 54.5% in 2022, a figure that has remained relatively steady under Biden. The main areas of growth in coverage, on a percentage basis, include: Medicaid, which enrolled 18.8% of the population in 2022, up 1 percentage point from 2020; Medicare, which covered 18.7% of the population, up 0.3 percentage points; and the Affordable Care Act marketplaces, which covered 3.6% of Americans, also up 0.3 percentage points.

    Oil Production and Imports

    Crude oil production averaged roughly 12.5 million barrels per day during Biden’s most recent 12 months in office (through July), according to Energy Information Administration data released in late September. That was almost 10.7% higher than the average daily amount of crude oil produced in 2020.

    The U.S. is currently headed for a record production year, as the EIA, in its October Short-Term Energy Outlook report, projected that crude oil production would average over 12.9 million barrels per day in 2023 — higher than the more than 12.3 million barrels per day in 2019.

    The EIA says higher well activity and higher oil prices have contributed to the increase in production, particularly in the Permian Basin region in eastern New Mexico and western Texas.

    Despite the increased output, however, U.S. imports of crude oil still averaged more than 6.3 million barrels per day over the same 12-month period — up 7.4% from average daily imports in 2020.

    Carbon Emissions

    Since our last update, there was another small decline in U.S. carbon dioxide emissions.

    In the most recent 12 months on record (ending in June), there were approximately 4.83 billion metric tons of emissions from the consumption of coal, natural gas and various petroleum products, according to the EIA. That’s down from the 4.88 billion metric tons as of our last report, but it’s still about 5.5% more than the 4.58 billion metric tons emitted in 2020.

    In its October forecast, EIA projected that total energy-related emissions in 2023 would drop to 4.75 billion metric tons — which would be lower than the amounts in 2021 and 2022.

    Home Prices & Homeownership

    Home prices — Home prices fell since our last report, peaking in June and declining ever since.

    The preliminary median sales price of existing single-family homes in the U.S. was $399,200 in September, marking the third straight month that prices have dropped, according to the National Association of Realtors.

    !function(e,n,i,s){var d=”InfogramEmbeds”;var o=e.getElementsByTagName(n)[0];if(window[d]&&window[d].initialized)window[d].process&&window[d].process();else if(!e.getElementById(i)){var r=e.createElement(n);r.async=1,r.id=i,r.src=s,o.parentNode.insertBefore(r,o)}}(document,”script”,”infogram-async”,”

    In its ongoing fight against inflation, the Federal Reserve raised its key interest rate in July for the 11th time since March 2022. As a result, mortgage rates have steadily increased and housing prices have cooled.

    The 30-year fixed rate mortgage average nationwide, as of Oct. 19, was 7.63%, according to Freddie Mac.

    “Not only are homebuyers feeling the impact of rising rates, but home builders are as well,” Sam Khater, Freddie Mac’s chief economist, said in an Oct. 19 press release. “Incoming data shows that the construction of new homes rebounded in September but as rates keep rising, home builders appear to be losing confidence. As a result, we expect construction to trend down in the short-term.”

    Despite the recent dip, the median home price was nearly 30% higher in September than it was in January 2021, when Biden took office.

    Homeownership — Homeownership rates have barely budged under Biden.

    The homeownership rate, which the Census Bureau measures as the percentage of “occupied housing units that are owner-occupied,” was 65.9% in the second quarter of 2023 — a tick higher than the 65.8% rate during Trump’s last quarter in office. (Usual word of caution: The bureau warns against making comparisons with the fourth quarter of 2020, because of pandemic-related restrictions on in-person data collection.) 

    The rate peaked under Trump in the second quarter of 2020 at 67.9%. The highest homeownership rate on record was 69.2% in 2004, when George W. Bush was president.

    Stock Markets

    The stock markets dipped since our last report, plodding through the weakest quarter of the year. Overall, however, all three major indexes have increased value under Biden — although only modestly in some cases.

    The S&P 500 stock index – which peaked for the year on July 31 and has been trending down since – was up 12.6% since Biden took office, as of the close of the markets on Oct. 19.  

    The Dow Jones Industrial Average, made up of 30 large corporations, has increased 8.0% under Biden. It peaked for the year on Aug. 1. The technology-heavy NASDAQ composite index, made up of more than 3,000 companies, crossed into positive territory under Biden in our last report. But a weak quarter now puts it down by less than 1%.

    Refugees

    As a candidate, Biden pledged to accept up to 125,000 refugees a year. The Biden administration fell far short of that lofty goal for the second straight fiscal year, but it is making some progress.

    In fiscal year 2023, which ended Sept. 30, the U.S. accepted 60,014 refugees — the highest total since fiscal year 2016, which was the last full fiscal year of the Obama-Biden administration, according to State Department data. It was also more than twice as many as the 25,465 refugees admitted in fiscal 2022.

    Overall, the U.S. has admitted 95,487 refugees in Biden’s first full 32 months in office, or 2,984 refugees per month, the data show. That’s about 62% higher than the 1,845 monthly average under Trump, who significantly reduced the admission of refugees. (For both presidents, the averages include only full months in office, excluding January in 2017 and 2021, when administrations overlapped.)

    But, in order to reach Biden’s target of 125,000, the U.S. needs to admit about an average of 10,417 refugees per month. Under Biden, the peak month was 8,762 in September.

    As it did in fiscal years 2023 and 2022, the administration has once again set the cap on refugee admissions at 125,000 for fiscal year 2024. In doing so, Secretary of State Antony Blinken said the Biden administration “has worked to rebuild, streamline, and expand the U.S. Refugee Admissions Program,” which the department has said was weakened by COVID-19 and a lack of resources under the Trump administration.

    “Admitting 125,000 refugees — an ambitious target not achieved in three decades — is now within reach,” Blinken said, referring to 1992, when the Clinton administration set the cap at 131,000 and admitted 132,531, according to the data compiled by the Migration Policy Institute.

    !function(e,n,i,s){var d=”InfogramEmbeds”;var o=e.getElementsByTagName(n)[0];if(window[d]&&window[d].initialized)window[d].process&&window[d].process();else if(!e.getElementById(i)){var r=e.createElement(n);r.async=1,r.id=i,r.src=s,o.parentNode.insertBefore(r,o)}}(document,”script”,”infogram-async”,”

    Immigration

    The number of apprehensions of those trying to cross the southern border illegally crept back up in July and August, to 132,648 and 181,059, respectively, according to the latest data from U.S. Customs and Border Protection. But that’s still lower than the apprehension figures between March and December 2022, when monthly numbers regularly topped 200,000.

    “Irregular migrant arrival numbers seem to be going back up but do remain below the highs seen at the start of the fiscal year,” Colleen Putzel-Kavanaugh, an associate policy analyst at the Migration Policy Institute, told us.

    “Looking at migration numbers through the Darien Gap and Central America it is clear that many people continue to be on the move, with their final destination possibly being the U.S.” Putzel-Kavanaugh said. “Irregular arrival numbers likely remain below the highs at the start of FY 2023 because of the new legal pathways available like the CBP One app and the parole programs for nationals of Cuba, Haiti, Nicaragua, and Venezuela.”

    CBP One is a mobile app created by the Biden administration that allows migrants to make appointments to seek asylum (and penalizes those who do not).

    On Sept. 20, the Department of Homeland Security announced a new “series of actions to increase enforcement across the Southwest Border, accelerate processing of work authorizations, and the decision to redesignate and extend Temporary Protected Status (TPS) for Venezuela.”

    Biden also asked Congress for $4 billion in supplemental funding for enhanced border security. But ultimately, Biden said Congress needs to pass comprehensive immigration reform.

    “As a result of Congress’ failure to enact the reform, the Administration has been using the limited tools it has available to secure the border and build a safe, orderly, and humane immigration system while leading the largest expansion of lawful pathways for immigration in decades,” DHS wrote.

    Looking at the entirety of Biden’s time in office, and to even out the seasonal changes in border crossings, we compare the most recent 12 months on record with the year prior to him taking office. And for the past 12 months ending in August, the latest figures available, apprehensions totaled 2,034,730, according to Customs and Border Protection. That’s 300% higher than during Trump’s last year in office.

    “Demand to enter the U.S. remains high and the options for legal entry, though vastly expanded, are still limited, which likely contributes to continued high numbers of irregular migrant arrivals,” Putzel-Kavanaugh said.

    Food Stamps

    Enrollment in the Supplemental Nutrition Assistance Program, or SNAP, declined each month since our last update. The program used to be known as food stamps.

    As of July, nearly 41.3 million people were receiving food assistance, the lowest monthly enrollment since August 2022. That figure is down about 1.5 million people from this year’s high of nearly 42.8 million in January, and it’s a decrease of about 2%, or 856,143 people, from when Biden became president in January 2021.

    The figures, which are preliminary, come from Department of Agriculture data updated this month.

    Despite the recent declines, the number of SNAP beneficiaries in July was still higher than the 40.8 million on the rolls in August and September 2021, which was the lowest participation under Biden.

    Debt and Deficits

    Debt — Since our last quarterly update, the public debt, which excludes money the government owes itself, increased by more than $783 billion to over $26.5 trillion, as of Oct. 17. That brings the total increase during Biden’s presidency to roughly $4.9 trillion, which is 22.5% higher than it was when Biden took office.

    Deficits — In its Monthly Budget Review for September, the Congressional Budget Office estimates that the federal deficit rose to nearly $1.7 trillion in fiscal year 2023, which ended on Sept. 30. That’s up about 23% from the nearly $1.4 trillion in fiscal year 2022, but still down 46% from the deficit of $3.1 trillion in fiscal year 2020.

    The Treasury Department is expected to release its finalized deficit figure for fiscal 2023 this month.

    Compared with fiscal 2022, CBO said that both revenues and spending were lower in fiscal 2023, but receipts were down by $455 billion, or 9%, compared with a decrease of $141 billion, or 2%, in outlays.

    Guns

    Handgun production — In 2022, annual production of pistols and revolvers in the U.S. totaled just under 7 million, according to figures in an interim report prepared in July by the Bureau of Alcohol, Tobacco, Firearms and Explosives.

    That is an increase of about 7.3% from 2020, when handgun production during the beginning of the pandemic surged to a then-record of over 6.5 million. The 2022 figure, if it holds, also would be an 11.8% decrease from the final 2021 figure of over 7.9 million.

    Prior to 2020, handgun production had gone down by more than a third under Trump through 2019. That was after production more than tripled during President Barack Obama’s time in office.

    !function(e,n,i,s){var d=”InfogramEmbeds”;var o=e.getElementsByTagName(n)[0];if(window[d]&&window[d].initialized)window[d].process&&window[d].process();else if(!e.getElementById(i)){var r=e.createElement(n);r.async=1,r.id=i,r.src=s,o.parentNode.insertBefore(r,o)}}(document,”script”,”infogram-async”,”

    Gun sales — The National Shooting Sports Foundation’s latest estimates suggest that gun purchases continued to decline during the third quarter of 2023.

    Since the federal government doesn’t collect data on gun sales, the NSSF, a gun industry trade group, estimates gun sales by tracking the number of background checks for firearm sales based on the FBI’s National Instant Background Check System, or NICS. The NSSF-adjusted figures exclude background checks unrelated to sales, such as those required for concealed-carry permits.

    The group’s adjusted NICS total for background checks during the third quarter of the year was over 3.28 million. That’s a nearly 12.8% drop from the roughly 3.76 million in the third quarter of 2022, and it’s also down close to 42% from the almost 5.63 million in Trump’s last full quarter in 2020.

    Through the first nine months of 2023, there were about 11.11 million background checks for firearm sales. That total is down 28% from the same period in 2020, down 19% from 2021 and down 6.6% from 2022 — which were the years with the first, second and third highest annual totals, respectively.

    Trade

    The international trade deficit is down from last year’s record high, but still up compared with Trump’s final year.

    According to Bureau of Economic Analysis figures published this month, the U.S. imported approximately $813.6 billion more in goods and services than it exported over the last 12 months through August. That’s an increase of more than $106.7 billion, or 24.6%, compared with 2020.

    But through the first eight months of 2023, the trade gap in goods and services was down $137.6 billion, or 20.7%, from the same period in 2022. Exports increased $22 billion, or 1.1%, and imports decreased $115.6 billion or 4.3%, the BEA said.

    The U.S. is currently on pace to have an annual trade deficit that is lower than the record of $951.2 billion in 2022 and the second-highest gap of $841.6 billion in 2021.

    Judiciary Appointments

    Supreme Court — So far, Biden has won confirmation for one Supreme Court justice, Ketanji Brown Jackson. She replaced retired Justice Stephen G. Breyer, an appointee of President Bill Clinton, and was confirmed on April 7, 2022. By this same point during Trump’s term, he had won confirmation for two Supreme Court justices.

    Court of Appeals — Biden also has won confirmation for 36 U.S. Court of Appeals judges. At the same point under Trump, 43 had been confirmed.

    District Court — For District Court confirmations, 110 judges have been confirmed under Biden, while 109 had been confirmed at the same point during Trump’s presidency.

    Biden has now won confirmation for four U.S. Court of Federal Claims judges. At this point under Trump, two such judges had been confirmed, as well as two U.S. Court of International Trade judges.

    As of Oct. 19, there were 68 federal court vacancies, with 28 nominees pending.


    Editor’s note: FactCheck.org does not accept advertising. We rely on grants and individual donations from people like you. Please consider a donation. Credit card donations may be made through our “Donate” page. If you prefer to give by check, send to: FactCheck.org, Annenberg Public Policy Center, 202 S. 36th St., Philadelphia, PA 19104. 

    Sources

    U.S. Bureau of Labor Statistics. “Employment, Hours, and Earnings from the Current Employment Statistics survey (National): Total Nonfarm.” Accessed 8 Oct 2023.

    U.S. Bureau of Labor Statistics. “Labor Force Statistics from the Current Population Survey: Unemployment.” Accessed 8 Oct 2023.

    U.S. Bureau of Labor Statistics. “Job Openings and Labor Turnover Survey: Job Openings.” Accessed 8 Oct 2023.

    U.S. Bureau of Labor Statistics. “Labor Force Statistics from the Current Population Survey: Labor Force Participation Rate.” Accessed 8 Oct 2023.

    U.S. Bureau of Labor Statistics. Monthly Labor Review. “Projections overview and highlights, 2021–31” Nov 2022.

    U.S. Bureau of Labor Statistics. “Employment, Hours, and Earnings from the Current Employment Statistics survey (National): Manufacturing.” Accessed 8 Oct 2023.

    U.S. Bureau of Labor Statistics. “Consumer Price Index – All Urban Consumers (Seasonally Adjusted).” Data extracted 10 Oct 2023.

    U.S. Bureau of Labor Statistics. Consumer Price Index Summary. News release. 13 Jul 2022.

    U.S. Energy Information Administration. “Weekly U.S. Regular All Formulations Retail Gasoline Prices.” Data extracted 17 Oct 2023.

    U.S. Bureau of Labor Statistics. “Employment, Hours and Earnings from the Current Employment Statistics survey (National); Average Weekly Earnings of Production and Nonsupervisory Employees, total private.” Data extracted 10 Oct 2023.

    U.S. Bureau of Labor Statistics. “Employment, Hours and Earnings from the Current Employment Statistics survey (National); Average Weekly Earnings of Production and Nonsupervisory Employees, 1982-1984 dollars, total private.” Data extracted 10 Oct 2023.

    State Department. “Presidential Determination on Refugee Admissions for Fiscal Year 2022.” 8 Oct 2021.

    “The Biden Plan for Securing Our Values as a Nation of Immigrants.” Biden campaign. Undated, accessed 18 Jan 2022.

    State Department. “Refugee Admissions Report.” 30 Sep 2023.

    White House. “Presidential Determination on Refugee Admissions for Fiscal Year 2023.” 27 Sep 2022.

    State Department. “Presidential Determination on Refugee Admissions for Fiscal Year 2024.” 29 Sep 2023.

    State Department. “Report to Congress on Proposed Refugee Admissions for Fiscal Year 2022.” 20 Sep 2021.

    “U.S. Annual Refugee Resettlement Ceilings and Number of Refugees Admitted, 1980-Present.” Migration Policy Institute. Updated, accessed 6 Oct 2023.

    Federal Reserve Bank of Atlanta. “GDP Now.” 18 Oct 2023.

    U.S. Bureau of Economic Analysis. “Table 1.1.1. Percent Change From Preceding Period in Real Gross Domestic Product.” Accessed 18 Oct 2023.

    The Conference Board. “US recession probability reaches 96 percent heading into Q4.” 29 Sep 2022

    U.S. Bureau of Economic Analysis. “Gross Domestic Product (Third Estimate), Corporate Profits (Revised Estimate), Second Quarter 2023 and Comprehensive Update.” 28 Sep 2023.

    BMO Economics. “North American Outlook: Sticking the (Soft) Landing.” 11 Sep 2023.

    Boocker, Sam and David Wessel. “What is a soft landing?” 14 Sep 2023.

    University of Michigan Surveys of Consumers. “Preliminary Results for October 2023.” Accessed 16 Oct 2023.

    University of Michigan Surveys of Consumers. “The Index of Consumer Sentiment.” Accessed 16 Jan 2023.

    US Census Bureau. “Business and Industry: Homeownership rates.” Accessed 7 Jul 2023. 

    Mateyka, Peter, and Mazur, Christopher. “Homeownership in the United States: 2005 to 2019.” US Census Bureau. Mar 2021.

    U.S. Census Bureau. “Quarterly Residential Vacancies And Homeownership, Fourth Quarter 2021.” 2 Feb 2022. 

    U.S. Census Bureau. “Time Series/Trend Charts: Not Seasonally Adjusted Home Ownership Rate.” Accessed 11 Oct 2023.

    U.S. Bureau of Economic Analysis. “National Income by Type of Income.” 28 Sep 2023.

    Boesler, Matthew. “US Corporate Profits Rise Again With Recession Fear Fading.” 30 Aug 2023.

    National Association of Realtors. “Sales Price of Existing Single-Family Homes.” Undated, accessed 19 Oct 2023.

    National Association of Realtors. “Sales Price of Existing Single-Family Homes.” Undated, accessed 19 Oct 2023.

    “Mortgage Rates Approach Eight Percent.” Press release. Freddie Mac. 19 Oct 2023.

    Yahoo! Finance. “Dow Jones Industrial Average.” Accessed 19 Oct 2023.

    Yahoo! Finance. “S&P 500.” Accessed 19 Oct 2023.

    Yahoo! Finance. “NASDAQ Composite.” 19 Oct 2023.

    U.S. Customs and Border Protection. Southwest Land Border Encounters. Accessed 19 Oct 2023.

    Guzman, Gloria and Melissa Kollar. “Income in the United States: 2022.” Census Bureau. 12 Sep 2023.

    Creamer, John, et. al. “Poverty in the United States: 2022.” Census Bureau. 12 Sep 2023.

    Dealer Wire. “NSSF-Adjusted NICS Background Checks for July 2023.” 4 Aug 2023

    Dealer Wire. “NSSF-Adjusted NICS Background Checks for August 2023.” 8 Sep 2023.

    Dealer Wire. “NSSF-Adjusted NICS Background Checks for September 2023.” 6 Oct 2023.

    U.S. Department of Agriculture. Supplemental Nutrition Assistance Program. Persons, Households, Benefits, and Average Monthly Benefit per Person & Household. 13 Oct 2023, accessed 18 Oct 2023.

    U.S. Bureau of Economic Analysis. U.S. Trade in Goods and Services, 1960-present. 5 Oct 2023, accessed 18 Oct 2023.

    U.S. Bureau of Economic Analysis. “U.S. International Trade in Goods and Services, August 2023.” 5 Oct 2023.

    U.S. Energy Information Administration. U.S. Field Production of Crude Oil. Accessed 16 Oct 2023.

    U.S. Energy Information Administration. U.S. Imports of Crude Oil. Accessed 16 Oct 2023.

    U.S. Energy Information Administration. “Monthly Energy Review, September 2023.” Table 11.1 Carbon Dioxide Emissions From Energy Consumption by Source. 26 Sep 2023.

    U.S. Energy Information Administration. “Short-Term Energy Outlook October 2023.” 11 Oct 2023.

    Congressional Budget Office. “Monthly Budget Review: September 2023.” 10 Oct 2023.

    U.S. Department of Treasury. Debt to the Penny. Accessed 18 Oct  2023.

    Keisler-Starkey, Katherine et. al. “Health Insurance Coverage in the United States: 2022.” Census Bureau. Sep 2023.

    Keisler-Starkey, Katherine et. al. “Health Insurance Coverage in the United States: 2021.” Census Bureau. 13 Sep 2022.

    Tolbert, Jennifer and Meghana Ammula. “10 Things to Know About the Unwinding of the Medicaid Continuous Enrollment Provision.” Kaiser Family Foundation. 5 Apr 2023.

    Centers for Disease Control and Prevention; National Health Interview Survey. “Health Insurance Coverage: Early Release of Estimates From the National Health Interview Survey, 2022.” May 2023.

    Centers for Disease Control and Prevention; National Health Interview Survey. “Health Insurance Coverage: Early Release of Quarterly Estimates From the National Health Interview Survey, January 2022–March 2023.” Aug 2023.

    Major Cities Chiefs Association. Violent Crime Survey – National Totals. Midyear Comparison January 1 to June 30, 2023 and 2022. 17 Aug 2023.

    Major Cities Chiefs Association. Violent Crime Survey – National Totals. Year End Comparison January 1 to December 31, 2022, and 2021. 10 Feb 2022.

    Major Cities Chiefs Association. Violent Crime Survey – National Totals. Year End Comparison January 1 to December 31, 2021, and 2020. 10 Feb 2022.

    Major Cities Chiefs Association. Violent Crime Survey – National Totals. Year End Comparison January 1 to December 31, 2020, and 2019. updated 14 Feb 2022.

    FBI. “FBI Releases 2022 Crime in the Nation Statistics.” Press release. 16 Oct 2023.

    FBI. “UCR Summary of Crime in the Nation, 2022.” 2023.

    FBI. Table 1, Crime in the United States, 2022. Accessed 19 Oct 2023. 

    Lopez, Ernesto et. al. “Crime Trends in U.S. Cities: Mid-Year 2023 Update.” Council on Criminal Justice. Jul 2023.

    United States Courts. Confirmation Listing, Judicial Confirmations for January 2023, 117th Congress. Updated 1 Jan 2023.

    United States Courts. Confirmation Listing, Judicial Confirmations, 118th Congress. updated 18 Oct 2023.

    United States Courts. Current Judicial Vacancies, 118th Congress. updated 19 Oct 2023.

    United States Courts. Confirmation Listing, Judicial Confirmations for January 2019, 115th Congress. updated 1 Jan 2019.

    United States Courts. Confirmation Listing, Judicial Confirmations for November 2019, 116th Congress. updated 1 Nov 2019.

    Source